


EBPF USDT: A Comprehensive Guide to Userland Statically Defined Tracing

EBPF USDT: A Comprehensive Guide to Userland Statically Defined Tracing
Understanding the intricacies of performance analysis and debugging can be a daunting task, especially when dealing with complex applications. Enter eBPF USDT, a powerful tool that allows developers to delve into the depths of user-space applications without the need for invasive modifications. In this article, we will explore the ins and outs of eBPF USDT, providing you with a detailed understanding of its capabilities and applications.
What is eBPF USDT?

eBPF USDT, short for Extended Berkeley Packet Filter Userland Statically Defined Tracing, is a technique that enables developers to insert static probes into user-space applications. These probes can be activated at runtime, allowing for real-time monitoring and analysis of application behavior. By leveraging eBPF USDT, you can gain valuable insights into the performance and functionality of your applications without the need for intrusive debugging tools.
How Does eBPF USDT Work?
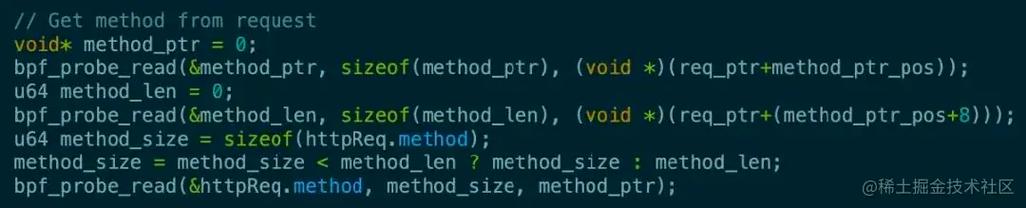
At its core, eBPF USDT operates by inserting static probes into the source code of user-space applications. These probes are defined using special macros that are added to the code during the compilation process. When the application is executed, the probes remain dormant until they are activated by a tracing tool, such as DTrace or SystemTap. Once activated, the probes collect and record relevant information, providing a wealth of data for analysis.
Here’s a simplified breakdown of the process:
| Step | Description |
|---|---|
| 1 | Define static probes in the source code using special macros. |
| 2 | Compile the application with the probes enabled. |
| 3 | Activate the probes at runtime using a tracing tool. |
| 4 | Collect and analyze the data generated by the probes. |
Applications of eBPF USDT
eBPF USDT finds applications in a wide range of scenarios, including performance analysis, debugging, and security auditing. Here are some common use cases:
-
Performance Analysis: By tracking the execution of specific functions or events, eBPF USDT can help identify performance bottlenecks and optimize application performance.
-
Debugging: eBPF USDT allows developers to capture detailed information about application behavior, making it easier to diagnose and fix issues.
-
Security Auditing: By monitoring user-space applications, eBPF USDT can help detect and prevent security vulnerabilities.
Comparing eBPF USDT with Other Tracing Techniques
While eBPF USDT offers numerous advantages, it’s important to understand how it compares to other tracing techniques. Here’s a brief comparison:
-
SystemTap: SystemTap is a powerful tool for tracing and debugging applications on Linux. However, it requires kernel modules and can be more complex to set up compared to eBPF USDT.
-
DTrace: DTrace is a popular tracing tool for Solaris and Linux systems. It provides a rich set of features for performance analysis and debugging. However, DTrace is primarily focused on kernel-space tracing, while eBPF USDT targets user-space applications.
Conclusion
eBPF USDT is a powerful tool for analyzing and debugging user-space applications. By providing a non-intrusive way to monitor application behavior, eBPF USDT enables developers to gain valuable insights into the performance and functionality of their applications. Whether you’re looking to optimize performance, diagnose issues, or ensure security, eBPF USDT is a valuable addition to your toolkit.


